Grafana Monitoring Stack
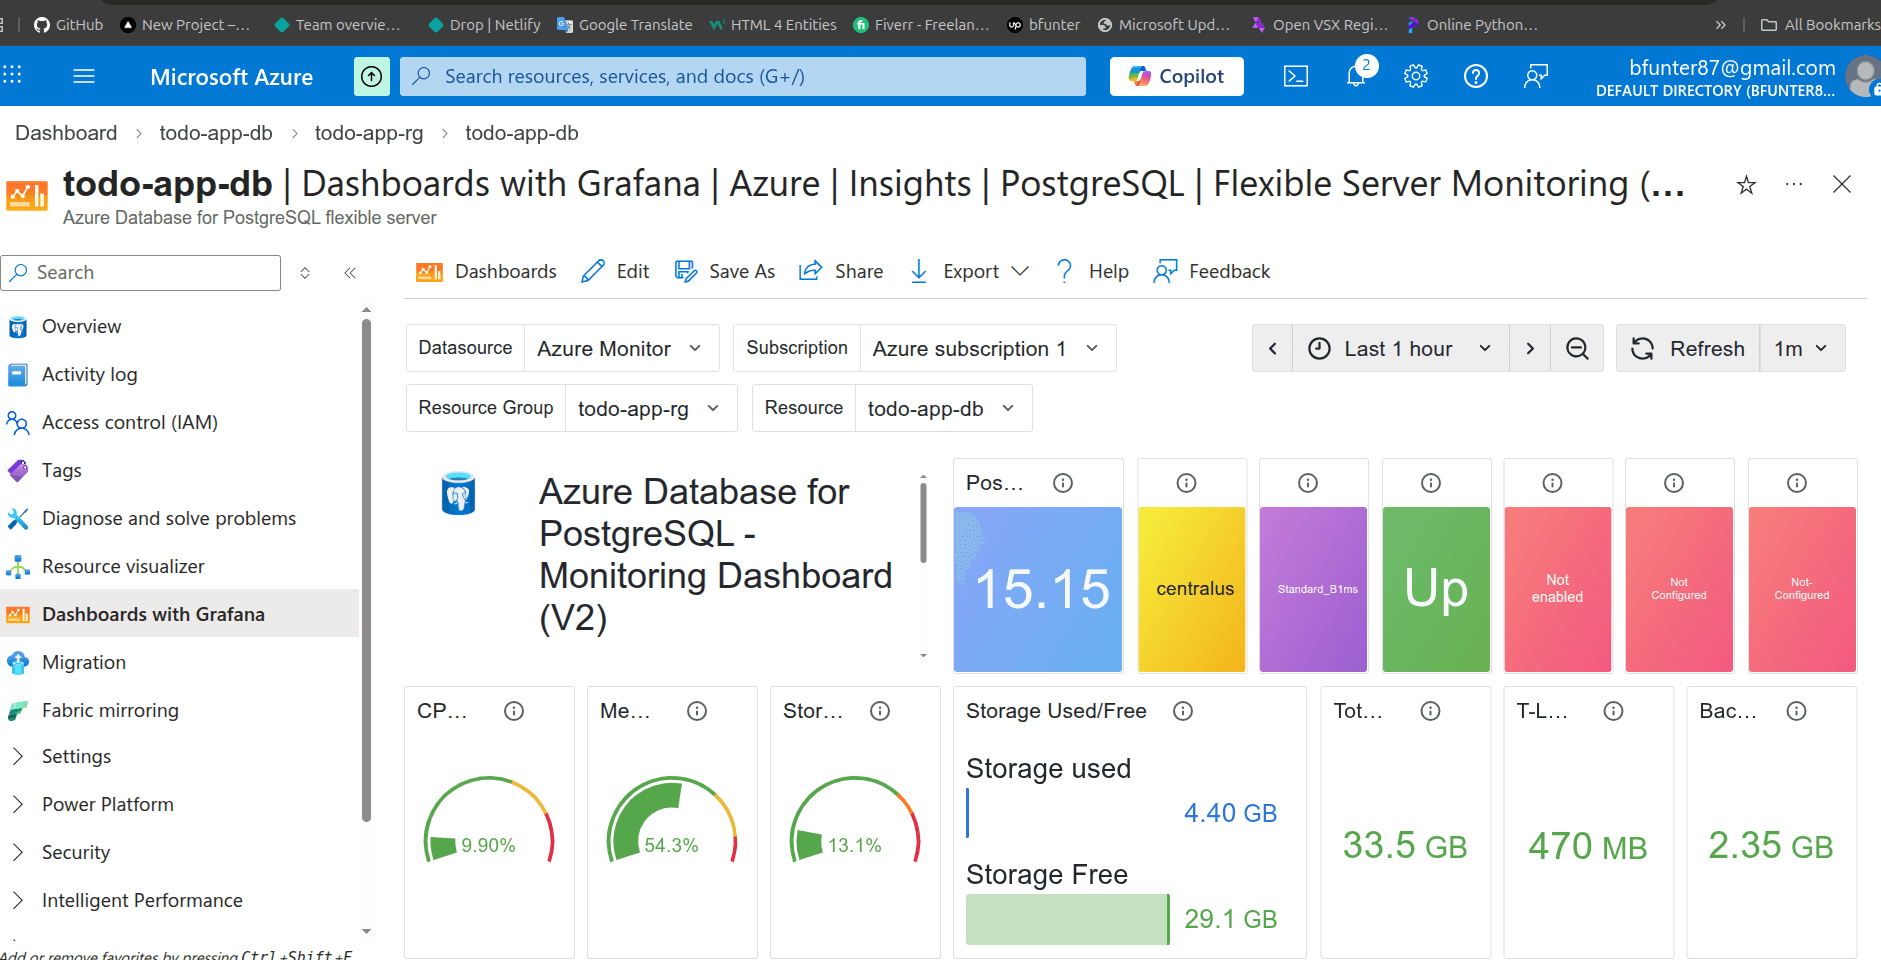
Comprehensive monitoring stack using Grafana for real-time observability, infrastructure metrics, and custom dashboarding for cloud environments.
01 — The Problem
The Problem
Cloud infrastructure had no unified observability layer, making it difficult to spot performance issues across environments in real time.
02 — The Solution
The Solution
Deployed a Grafana-based monitoring stack with custom dashboards for real-time observability of infrastructure metrics across cloud environments, so the team can watch system health without manual polling.
03 — Tech Stack
Tech Stack
- Grafana
- Azure Cloud
- Observability
- Custom Dashboards
04 — Results & Impact
Results & Impact
Established real-time observability for the platform, turning scattered environment checks into one set of always-on dashboards.
My role Set up the monitoring stack and configured the dashboards.